General Market News:
- The 10-year Treasury yield opened at 0.66 percent on Monday, while the 2-year came in at 0.17 percent and the 30-year at 1.43 percent. We are set to get some May economic numbers this week, which should give us a clearer view on where we stand as an economy. The Federal Reserve meets next week, and, while it has done a lot and has essentially asked Congress to step in, it should be interesting to see what members have to say when faced with hard May economic numbers.
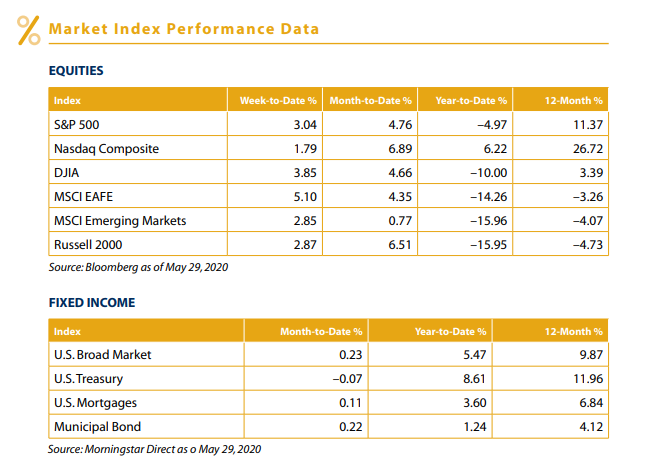
- Global equities rallied last week, as investors grew optimistic after Dr. Anthony Fauci said a vaccine could be available by November or December. For the second week in a row, value continued to outperform as the positive news saw beaten-down value stocks bounce back. U.S. and China trade tensions picked up again as the U.S. suspended Hong Kong’s special tariff rates following the proposal of a new national security law there. Emerging markets understandably lagged the S&P 500 and Dow Jones Industrial Average for the week, while international markets outperformed amid European reopenings. The top-performing sectors were financials, industrials, REITs, and utilities. Underperforming sectors were communication services, energy, and technology.
- The Conference Board Consumer Confidence Index for May was released last Tuesday. Confidence rose from a downwardly revised 85.7 in April to 86.6 in May. This was slightly worse than expectations for an increase to 87 but still a step in the right direction. Consumer expectations for the future increased during the month; however, views of the present condition worsened modestly. Altogether, this was a largely positive report because it indicates consumer confidence may have bottomed in April and could be set to rebound as states continue to reopen. As hopes of a swift economic recovery largely rely on a quick rebound for consumer confidence and spending, this report will be watched closely.
- On Tuesday, April’s new home sales report was released. New home sales came in much better than expected, increasing modestly from a downwardly revised annual rate of 619,000 in March to 623,000 in April, against forecasts for a fall to 480,000. Despite this better-than-expected performance, the pace of new home sales is still down notably from its recent high of 717,000, set in January. We saw strong growth in new home sales in 2019, and this momentum continued into 2020 before the pandemic hit. Looking forward, the slowdown in new home construction in March and April will likely serve as a headwind for future new home sales because of lowered supply in key markets.
- On Thursday, the second estimate of first-quarter gross domestic product (GDP) growth was released. Economic growth was revised down from an annualized –4.8 percent to –5 percent. page 2 of 4 Weekly Market Update JUNE 1, 2020 General Market News (continued) Personal consumption, the major driver of GDP growth in 2019, improved slightly to –6.8 percent annualized during the quarter, from an initial estimate of –7.6 percent. Despite this better-than-expected revision to consumption growth, this still represents the worst quarter for personal consumption since the second quarter of 1980. Although these very weak growth figures are concerning, they are likely just the tip of the iceberg; economists are forecasting a 33.5 percent annualized contraction for the economy in the second quarter.
- Thursday also saw the release of the preliminary estimate of April’s durable goods orders report. Orders came in slightly better than expected, falling by 17.2 percent during the month against forecasts for a 19 percent decline. As was the case in March, much of the decline in headline orders during the month can be attributed to a fall in volatile aircraft orders. Core durable goods orders, which strip out the impact of volatile transportation orders, came in much better than expected, falling 7.4 percent against calls for a 15 percent decline. While this result is a positive development, it still represents the largest single-month drop in core orders in more than a decade. Core durable goods orders are often used as a proxy for business investment, so this report indicates that already weak business spending in the first quarter likely worsened to start the second quarter.
- On Friday, April’s personal income and personal spending reports were released. Personal spending, which accounts for roughly two-thirds of total economic activity, fell by 13.6 percent during the month, worse than the expected 12.8 percent decline. This was the worst monthly decline in spending since records began in 1959. Personal incomes increased by 10.5 percent during the month, far surpassing estimates for a 5.9 percent decline. Incomes were boosted by the Coronavirus Aid, Relief, and Economic Security (CARES) Act payments to consumers during the month. Despite the better-than-expected result for income growth, the historically bad spending highlights the massive disruption to consumer spending that shelter-in-place orders had during the month.
- Finally, we finished the week with Friday’s release of the second and final estimate of the University of Michigan consumer sentiment survey for May. Consumer confidence fell slightly during the month, down from 73.7 midmonth to 72.3 at month-end, against expectations for a modest increase to 74. Despite the modest decline, this still represents a step in the right direction after the index hit an eight-year low of 71.8 in April. This echoes the results from the Conference Board Consumer Confidence Index, released on Tuesday. As is the case with that report, this will be a widely followed release because it will give a glimpse into how consumers are reacting to the easing of shelter-in-place orders as we head into the summer.
What to Look Forward To:
We started the week with Monday’s release of the Institute for Supply Management (ISM) Manufacturing index for May. This measure of manufacturer confidence increased modestly from 41.5 in April to 43.1 in May, against expectations for a larger increase to 43.8. While this gain was a positive development, this is a diffusion index, where values below 50 indicate contraction, so the index remains at a concerning level. The manufacturing industry was hard hit in April by factory shutdowns and a steep drop in global demand due to the pandemic, but efforts to reopen factories in May bolstered confidence modestly. While the factory openings should be a tailwind for manufacturer confidence in the short term, the drop in global demand will likely linger and serve as a headwind for a swift increase in this indicator.
On Wednesday, we will see the release of the ISM Nonmanufacturing index. This measure of service sector confidence is also expected to increase modestly, from 41.8 in April to 44 in May. This is another diffusion index, where values below 50 indicate contraction. So, while the projected May increase would be positive, confidence would still sit well below levels needed to support a swift economic recovery. Ultimately, while an uptick in business confidence would certainly be welcome, modest increases linked to reopening efforts would be unlikely to significantly increase business investment without a marked improvement in economic conditions.
On Thursday, the initial jobless claims for the week ending May 30 will be released. Economists expect to see an additional 1.8 million initial unemployment claims filed during the week, marking the ninth straight week of declining initial claims. This result would bring the total amount of initial claims filed during the pandemic to roughly 42 million. Despite the anticipated decline for initial claims in the last week of May, we will continue to closely monitor this weekly release until levels get closer to historical norms. We will also be keeping a close eye on the continuing claims report set to be released at the same time, to see if the decline the previous week is sustainable or a one-off result.
Thursday will also see the release of the April international trade report. The trade deficit is expected to narrow, from $44.4 billion in March to $41.5 billion in April. Previously released data for the trade of goods during the month showed exports falling by more than 25 percent in April, offsetting a 14.3 percent decline for imports over the same period. That data brought the trade gap for goods to its widest level in seven months. Looking forward, trade is expected to show continued weakness in the short term, as the disruptions caused by the pandemic should serve as a headwind for global trade growth.
We’ll finish the week with Friday’s release of May’s employment report. Economists expect to see 8 million additional jobs lost during the month, following more than 20 million job losses in April. This would bring the unemployment rate up to 19.5 percent, notably higher than the 14.7 percent unemployment rate reported in April. For context, this would be the worst result for unemployment since the Great Depression, when the unemployment rate was estimated to peak at just under 25 percent. Given the continued pace of mass layoffs throughout May, the unemployment report will likely reflect the truly devastating impact that anticoronavirus measures have had on the livelihood of millions of Americans.
Certain sections of this commentary contain forward-looking statements that are based on our reasonable expectations, estimates, projections, and assumptions. Forward-looking statements are not guarantees of future performance and involve certain risks and uncertainties, which are difficult to predict. All indices are unmanaged and are not available for direct investment by the public. Past performance is not indicative of future results. The S&P 500 is based on the average performance of the 500 industrial stocks monitored by Standard & Poor’s. The Nasdaq Composite Index measures the performance of all issues listed in the Nasdaq Stock Market, except for rights, warrants, units, and convertible debentures. The Dow Jones Industrial Average is computed by summing the prices of the stocks of 30 large companies and then dividing that total by an adjusted value, one which has been adjusted over the years to account for the effects of stock splits on the prices of the 30 companies. Dividends are reinvested to reflect the actual performance of the underlying securities. The MSCI EAFE Index is a float-adjusted market capitalization index designed to measure developed market equity performance, excluding the U.S. and Canada. The MSCI Emerging Markets Index is a market capitalization-weighted index composed of companies representative of the market structure of 26 emerging market countries in Europe, Latin America, and the Pacific Basin. The Russell 2000® Index measures the performance of the 2,000 smallest companies in the Russell 3000® Index. The Bloomberg Barclays US Aggregate Bond Index is an unmanaged market value-weighted performance benchmark for investment-grade fixed-rate debt issues, including government, corporate, asset-backed, and mortgage-backed securities with maturities of at least one year. The U.S. Treasury Index is based on the auctions of U.S. Treasury bills, or on the U.S. Treasury’s daily yield curve. The Bloomberg Barclays US Mortgage Backed Securities (MBS) Index is an unmanaged market value-weighted index of 15- and 30-year fixed-rate securities backed by mortgage pools of the Government National Mortgage Association (GNMA), Federal National Mortgage Association (Fannie Mae), and the Federal Home Loan Mortgage Corporation (FHLMC), and balloon mortgages with fixed-rate coupons. The Bloomberg Barclays US Municipal Index includes investment-grade, tax-exempt, and fixed-rate bonds with long-term maturities (greater than 2 years) selected from issues larger than $50 million.
Authored by the Investment Research team at Commonwealth Financial Network.
© 2020 Commonwealth Financial Network®